Dashboard
How the practice is doing, on one screen
A hospital has analysts. You have a morning. Every number here is computed from your own records.

Dashboard
A hospital has analysts. You have a morning. Every number here is computed from your own records.

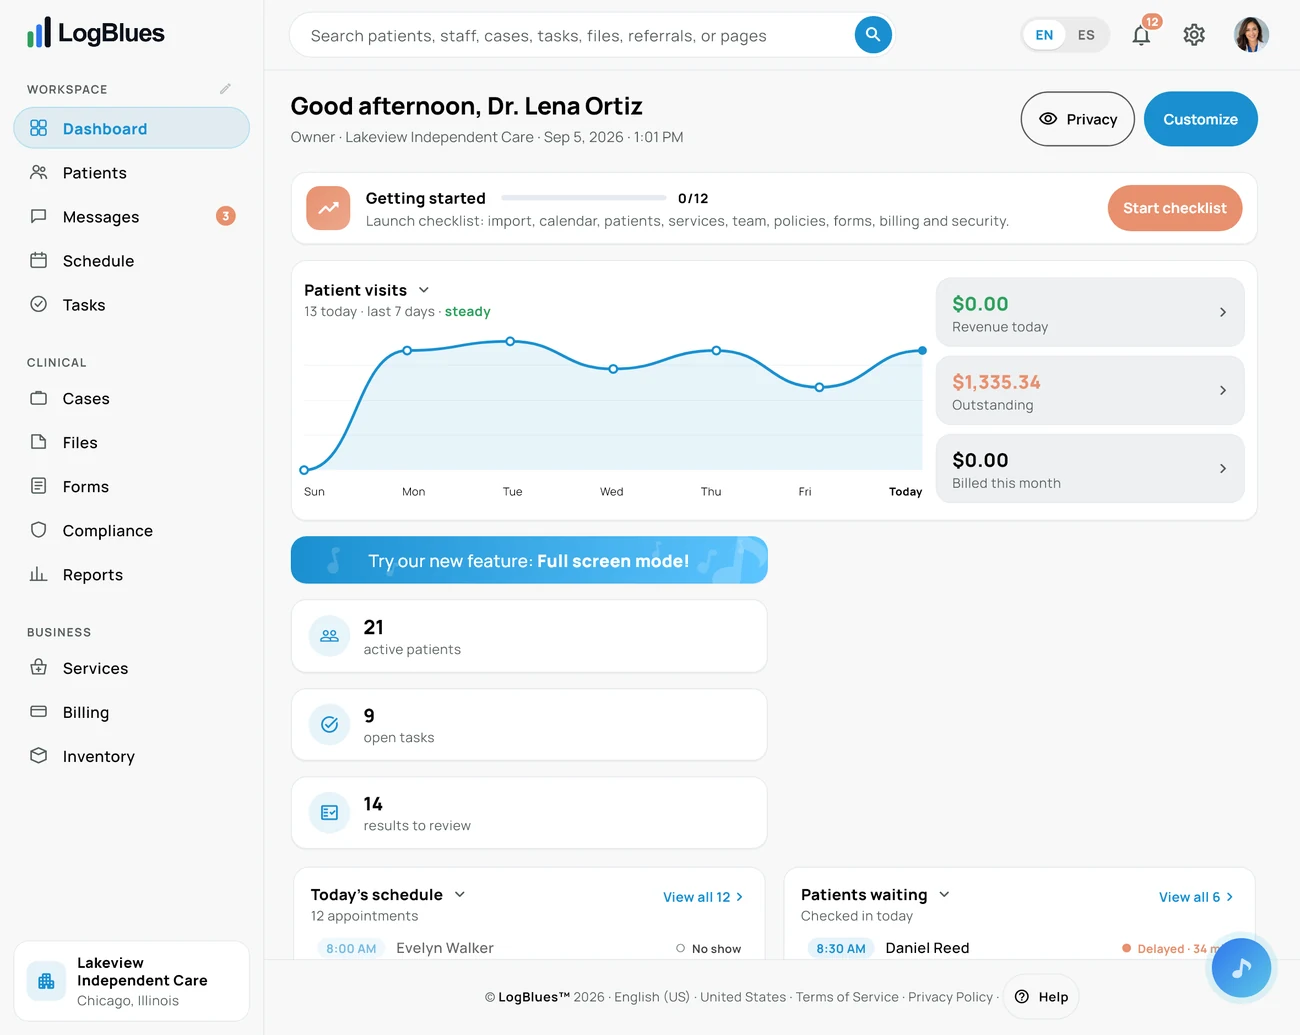
Owners and administrators see the Launch Checklist near the top of the Dashboard after signing in. It walks through the ten decisions that make the workspace fit the practice: identity and hours, services and prices, staff roles, policies, inventory, forms, reports, files, billing and security.
Each item opens the real LogBlues screen where that work belongs, so setup improves the workspace instead of filling out a demonstration checklist. Progress saves as you go, the clinic can keep working, and an owner can return with the right staff member when a decision needs their input.
The dashboard arrives arranged sensibly and then gets out of the way. One button on it opens Customize home, and from there the screen is yours: drag a card into the order your morning actually runs in, close the ones you never look at, and add any of them back from the row underneath.
There are ten cards to choose from — today’s schedule, patients waiting, results to review, unfinished notes, tasks due, outstanding invoices, recent files, staff availability, the visit trend and patient flow. Keep two of them or keep all ten. A billing manager and a provider do not want the same first screen, and nothing here makes them share one.
The theme lives in that same dialog, so changing how the screen looks and what is on it is one trip rather than two.
The menu down the left is separate, and it belongs to the person rather than the practice. Each signed-in user reorders it and hides what they do not use, saved under their own account, and puts it back to the original in one click. The dashboard is the one thing that cannot be hidden — it is the way back.
None of this needs an administrator, a support ticket or a higher tier. It is one dialog, and it takes about a minute.
A statistic you cannot act on is decoration. Clicking a day on the visit graph opens the schedule for that day, so the number leads straight to the underlying record.
Because the software is local-first, the records behind these numbers are yours and exportable. There is no enterprise reporting tier and no waiting on a vendor to run a query for you.
And nothing about your practice or your patients is sold or shared. The numbers are for you.
This is one part of LogBlues, the local-first practice workspace. The full picture is on the features page, and the product page shows it running.
Desktop, tablet and phone
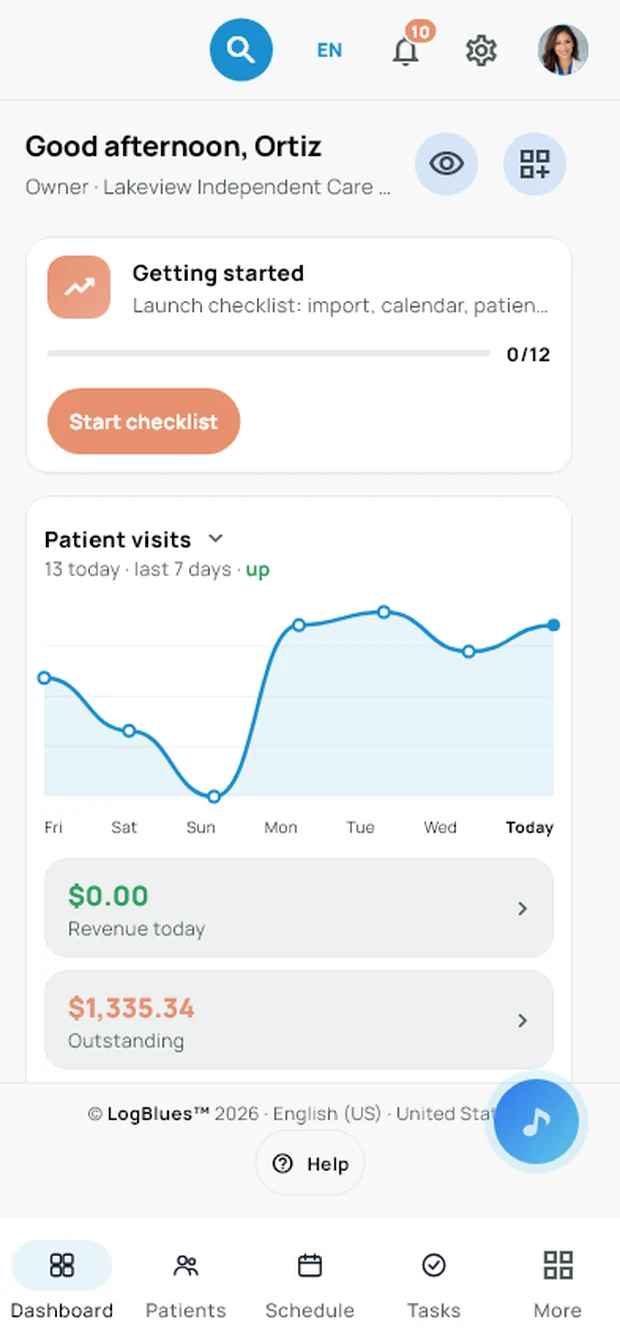
The same live schedule, patient flow, tasks, results and financial position follow the team from the front desk to the exam room.